If you are logged in as a corporate account user and have selected a retail location, the default display option is Location Totals.
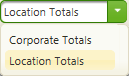
If you have changed the default display option, select Location Totals to display totals for the retail location.
The Instant Games page displays total weekly retailer sales for Instant games by price point. All Instant game sales and totals are displayed by game for full accounting weeks that fall within the Start Date and End Date. The default Start Date and End Date display the last 13 full accounting weeks.
Each row displays the weekly total and percentage of total sales for each Instant game price point on the page, as well as a weekly total for all Instant games price points. The Totals row displays report totals for the weekly total and for each Instant game price point. The Averages row displays report averages for the weekly total and for each Instant game price point.
NOTE: The color of the “Currently viewing:” message below the title of the report will change between blue and red depending on the following:
If only a Corporate Account is selected in the Select a Corporate Account field, the “Currently viewing:” message displays in red.
If a Retailer Location is selected in the Select a Location field, the “Currently viewing:” message displays in blue.
If a Corporate Account and Retailer Location is selected, the “Currently viewing:” message displays in blue.
Display totals by retail location.
Display data for a different time period.
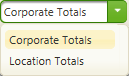
 next to the


 to export the data. The following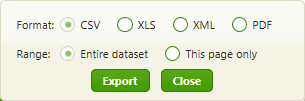
 .
.