-
Click
 next to the Start Date field and select a start date from the calendar.
 -
Click
next to the End Date field and select an end date from the calendar.
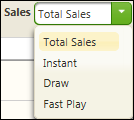
The Comparative Analysis page displays a graphical representation of sales and commissions, broken down as Instant, Draw, Fast Play, and Total Sales (the sum of each game type sales that week).
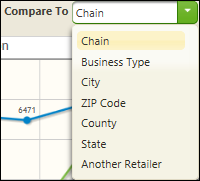
NOTE: A retailer can only be compared to another retailer within the same chain.
NOTE: The color of the “Currently viewing:” message below the title of the report will change between blue and red depending on the following:
If only a Corporate Account is selected in the Select a Corporate Account field, the “Currently viewing:” message displays in red.
If a Retailer Location is selected in the Select a Location field, the “Currently viewing:” message displays in blue.
If a Corporate Account and Retailer Location is selected, the “Currently viewing:” message displays in blue.
Display data for a different time period.
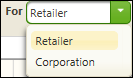
Define the data to be included in the view.
Display data in the Line Chart view.
Display data in the Tabular view.
Add or remove data lines from the Line Chart.
Sort data by a specific column in the Tabular view.